


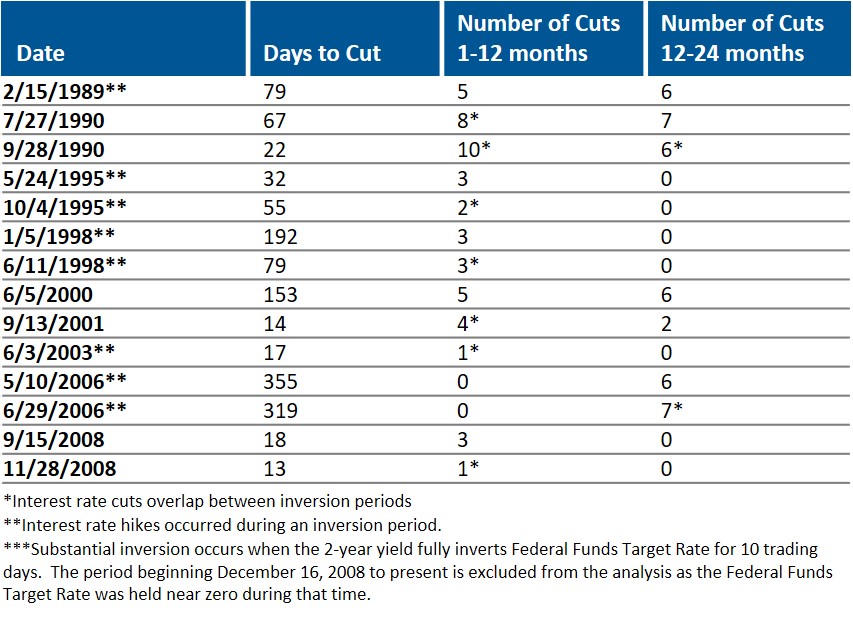
When the 2-year note falls beneath the yield of Fed Funds, it is often a signal that a Fed easing is not too distant in the future. Since 1988 there have been several occasions when the yield of the 2-year Treasury has fallen beneath Fed Funds. In most cases where the 2-year note has fallen beneath Fed Funds for a sustained period, a cut in Fed Funds has occurred within 12 or 24 months. In certain cases, the easing in Fed policy has been fast. The time between a sustained inversion and a Fed rate cut has been as little as 13 days. In the cases where it has taken longer, the time between inversion in this relationship and the Fed rate cut has usually been under 90 days. On rare occasions it has taken a long time. The table and charts below highlight this relationship.
Importantly, there are two cases where the time between the inversion in yields between Fed Funds and the 2-Year Treasury has taken longer: 2000 and 2006. In both cases the distance between inversion and the first-rate cut was lengthy because the Fed was concerned about containing a market bubble. In the first case, a bear market ensued and was worsened by the 2001 terrorist attacks. In the second instance, the Great Recession occurred. We believe the Fed is mindful of these examples and this data set and understands the risks of remaining two restrictive, for too long, when market indicators are blinking yellow.
The first chart shows the history of Fed Funds since 1988. It’s worth noting that in the 1990’s Fed policy was somewhat more reactive – this can be seen in the swiftness that occurred sometimes between tightening and easing cycles. The second chart shows the relationship between Fed Funds and 2-year note yields, and highlights that when an inversion occurs in this relationship an easing might be in the future. The third chart shows that the yield on the 2-year note has fallen beneath Fed Funds in recent weeks. It’s worth noting that data sets often have noise and the period between 2008 and 2013 is very noisy. Both Fed Funds and the 2-year note traded near 0% at this time, so did the yield on the 2-year note. The relationship between these instruments at a level of rates near 0% created a lot of noise in the data set and is excluded from this analysis.
For all the talk about what Powell will do next, history suggests he will likely ease. For further context of this policy decision, it’s best to keep an eye on this relationship and TIPS break-evens, which have been so constructive in helping to foretell the tone and direction of Fed policy as noted in prior bulletins. TIPS break-evens – the markets expectation of future inflation – remain beneath the Fed’s policy objectives – and the Fed is not likely to tighten until there is a cushion between inflation and 2%. The final chart shows the inflation expectations as measured by 10-year TIPS. There has even been talk that this objective should be increased, which could happen under an accommodative Fed. This will likely further support risk markets and contribute towards a weaker dollar. We believe this would be positive for non-dollar investments such as developed market equities and EM.
Number of Sustainable Inversions Since 1990: 14***
Federal Funds Rate
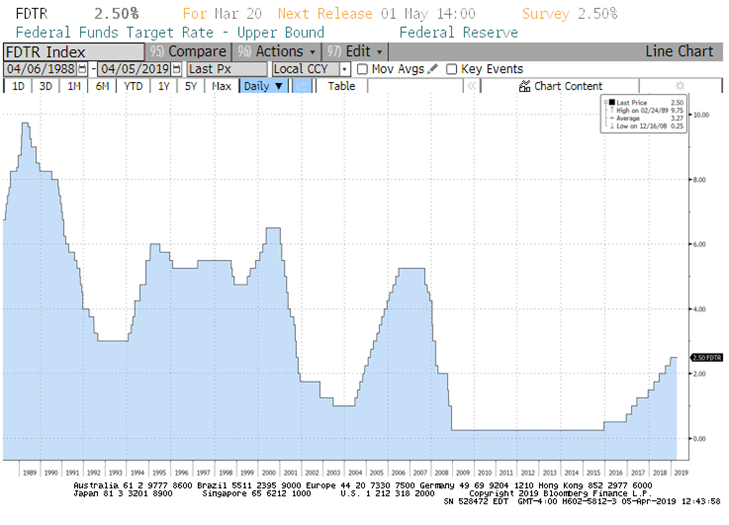
Source: Bloomberg, accessed 4/6/2019
Historic Relationship Between 2-Year Treasury Note and Fed Funds Rate
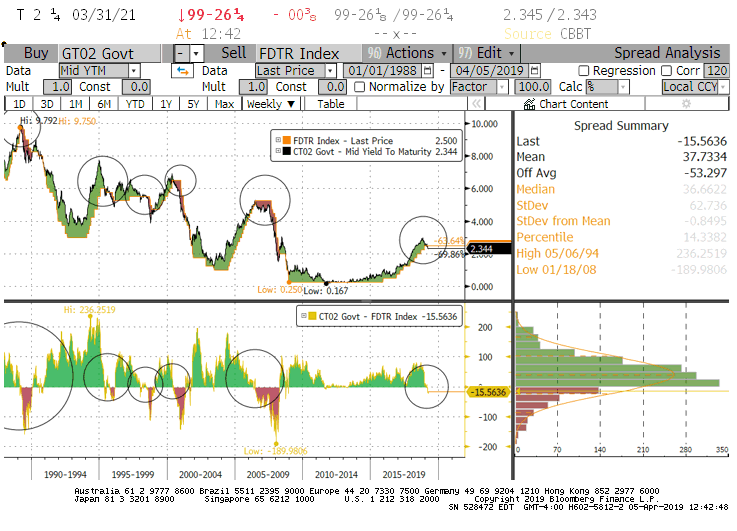
Source: Bloomberg, accessed 4/6/2019
Recent Relationship Between 2-Year Treasury Note and Fed Funds Rate
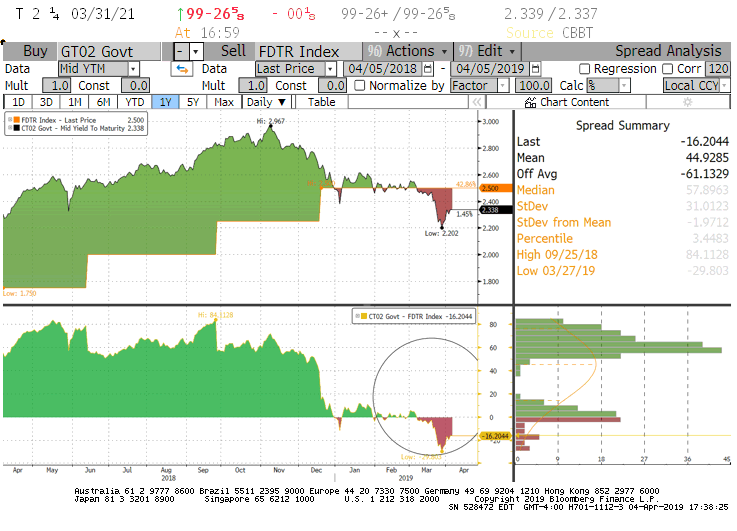
Source: Bloomberg, accessed 4/6/2019
10-Year TIPS Breakevens
Source: Bloomberg, accessed 4/6/2019
Jonathan E. Lewis
Chief Investment Officer