


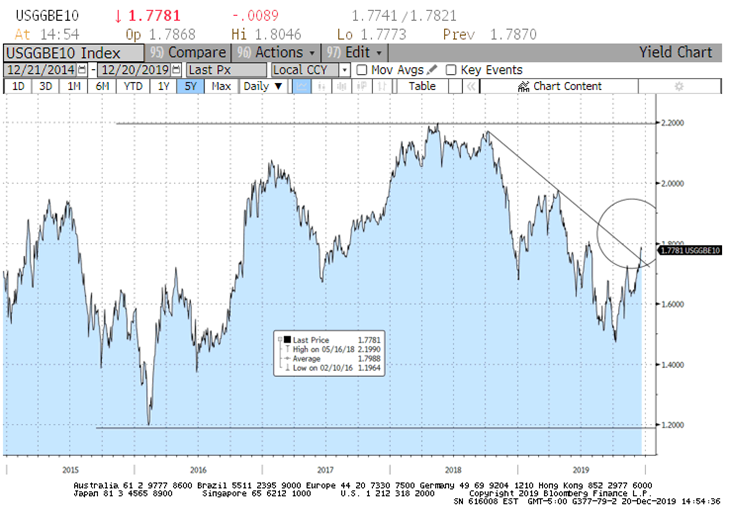
We have been watching the TIPS break-even carefully the past week and it has now confirmed a break-out in inflation expectations that we believe increases the probability that the break-even inflation rate on the 10-year TIP moves towards 2.2% (Chart 1).
Rising TIPS break-evens are consistent with the recent monetary easing, a low unemployment rate, high consumer confidence, and an accelerating economy. The Fed is likely relieved to see that the monetary battle against disinflation is gaining the upper hand.
We believe the commodity markets and the US dollar are confirming and assisting in this shift in inflation expectations:
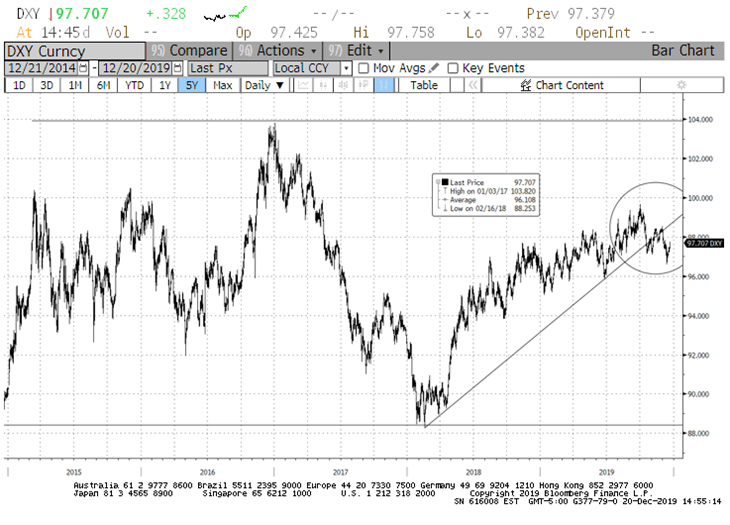
- The US dollar, as measured by the US Dollar Index (DXY), has been making a long-term top and finally may be rolling over (Chart 2).
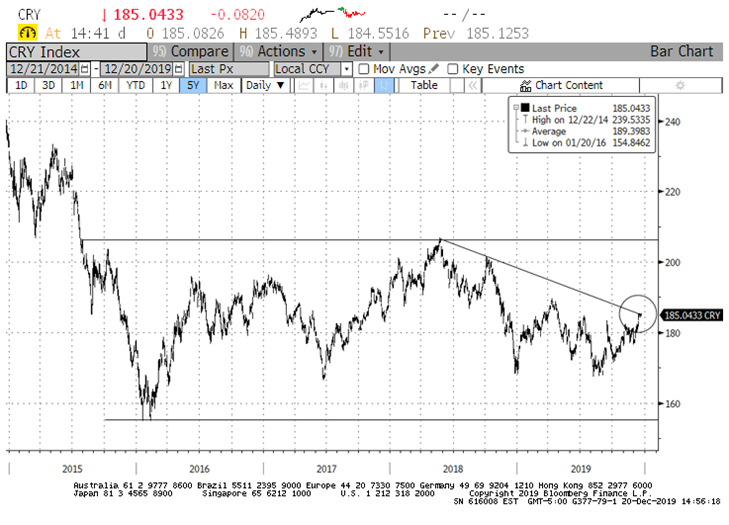
- A weaker US dollar is typically associated with rising commodity prices. We can see that the Commodity Research Bureau Index (CRB) is beginning to challenge an important intermediate term resistance level. If the CRB breaks out on the upside (Chart 3), this could lead to a move towards the top of the multi-year trading range. This would likely support a similar move by TIPS break-evens. Increased consideration of commodity related exposures and inflation hedges are worth considering for the longer-term if these events unfold.
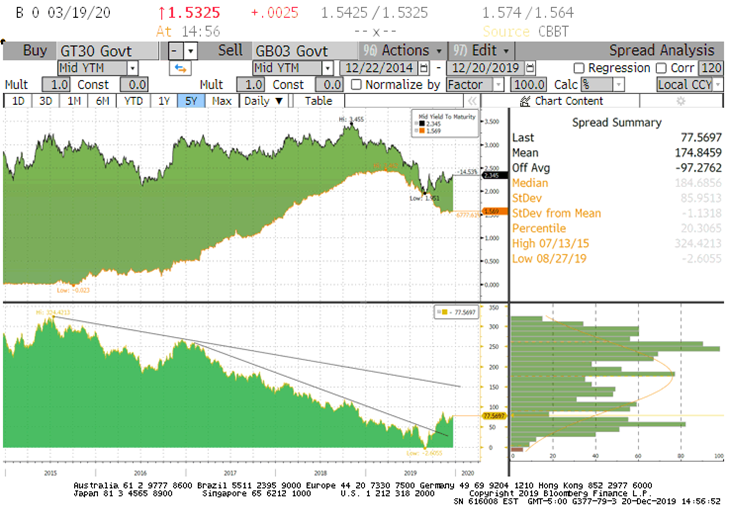
- With the Fed on hold at the short end of the curve, we would expect rising inflation expectations to lead to a steeper yield curve – this is exactly what is now happening. The slope between T-bills and 30-year Treasury bonds has broken an important intermediate term downtrend. If it challenges the longer-term downtrend the curve could move from +77 to +150 (Chart 4).
A weaker US dollar, rising inflation expectations, and a steeper curve are important market-based indicators suggesting spirits are rising. We believe this supports a continued risk-on outlook, an overweight to stocks, and an underweight to bonds. Within equities, EM remains especially worth considering because of attractive valuations and given the outperformance many EM markets often enjoy when the dollar is weakening.
10 Year TIPS (Chart 1)
US Dollar (Chart 2)
Commodity Research Bureau Index (CRB) (Chart 3)
3-Month T-Bill/ 30-Year Treasury Slope (Chart 4)
All charts sourced from Bloomberg, accessed 12/21/19