


We believe the Fed’s next move is likely an easing and it may come as early as the summer.
This would likely be positive for stocks, positive for inflation hedges, and negative for the dollar. A Fed easing in 2020 would support tight spread relationships between corporate bonds and treasury bonds, and likely contribute to a steeper curve. Here’s the argument for this projection:
On April 11, 2019, I released a bulletin stating the Fed’s next move would likely be an easing, link here. In that bulletin I noted that the yield of the 2-year Treasury had fallen meaningfully beneath Fed Funds and it was a reliable signal of an easing. At that time, the Fed was still embarked on a tightening cycle, and the Fed’s dot plots as of their March 20, 2019 signaled the Fed still believed it would be raising rates in the months and years ahead (Figure 1).
When the Fed eased in July 2019, the relationship between Fed Funds and the 2-year note began to normalize. But in recent weeks it has become more severely inverted again (Figure 2). Though the Fed has been on pause in recent months (Figure 3), we believe the next move is likely an easing (see the 2019 bulletin for more detail on the significance of this relationship). This easing would likely support inflation expectations, growth, and equity market valuations. The Fed’s summer 2019 easing initially led to a steeper curve, but it has been flattening again. The Fed’s 2019 easing also initially led to a rise in inflation expectations as measured by TIPS break-evens – and they have fallen again in recent weeks. A Fed that eases will likely contribute to a steeper curve once more. This would likely support credit creation and economic growth – a positive development for risk-on.
(Figure 1) Federal Reserve Rate Projections:

Source: Bloomberg, accessed 2/14/20
(Figure 2) Relationship between 2 Year Treasury and Fed Funds:
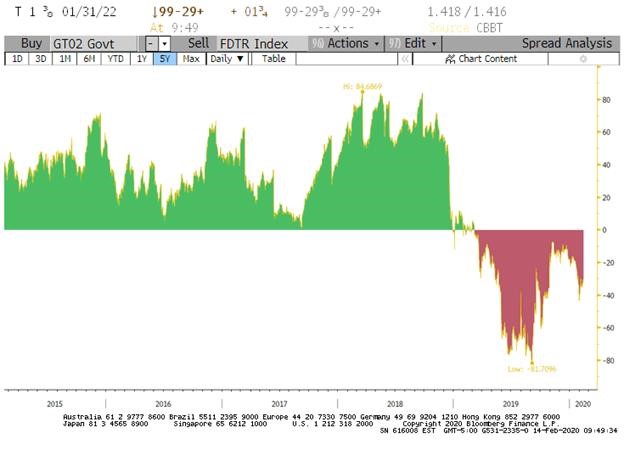
Source: Bloomberg, accessed 2/14/20
(Figure 1) Fed Funds Target Rate:
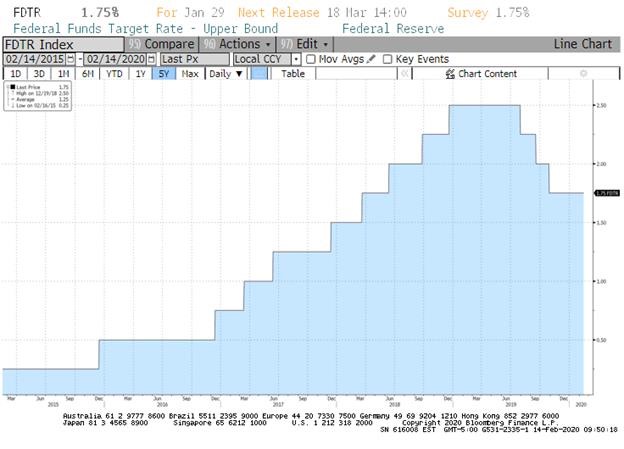
Source: Bloomberg, accessed 2/14/20