Fixed Income   |   March 5, 2020

Coronavirus and Municipal Bond Sectors

Caroline Grandoit
Global Head of Total Portfolio Solutions
Robert Petty
Executive Director and Chief Executive Officer, Fiera Asia
Caroline Grandoit
Global Head of Total Portfolio Solutions
Robert Petty
Executive Director and Chief Executive Officer, Fiera Asia
Judy Wesalo Temel
Senior Vice President, Director of Credit Research
Judy Wesalo Temel
Senior Vice President, Director of Credit Research
Candice Bangsund
Vice President and Portfolio Manager, Global Asset Allocation and Private Markets Solutions
Dominic Bokor-Ingram
Senior Portfolio Manager
Candice Bangsund
Vice President and Portfolio Manager, Global Asset Allocation and Private Markets Solutions
Dominic Bokor-Ingram
Senior Portfolio Manager
Judy Wesalo Temel
Senior Vice President, Director of Credit Research
Dominic Bokor-Ingram
Senior Portfolio Manager
Judy Wesalo Temel
Senior Vice President, Director of Credit Research
Judy Wesalo Temel
Senior Vice President, Director of Credit Research
Kenneth M. Potts
Senior Vice President, Portfolio Manager
Dexter J. Torres
Senior Vice President, Portfolio Manager, Head of Trading
Brian P. Meaney
Senior Vice President, Taxable Bond Strategist
Candice Bangsund
Vice President and Portfolio Manager, Global Asset Allocation and Private Markets Solutions
Candice Bangsund
Vice President and Portfolio Manager, Global Asset Allocation and Private Markets Solutions
Brian P. Meaney
Senior Vice President, Taxable Bond Strategist
Judy Wesalo Temel
Senior Vice President, Director of Credit Research
Brian P. Meaney
Senior Vice President, Taxable Bond Strategist
Candice Bangsund
Vice President and Portfolio Manager, Global Asset Allocation and Private Markets Solutions
Judy Wesalo Temel
Senior Vice President, Director of Credit Research
Reese K. Trucks
Vice President, Credit Research
Josefa Palma
Investment Counselor, Private Wealth
Carolyn N. Dolan
Executive Vice President, Head of US Private Wealth
Candice Bangsund
Vice President and Portfolio Manager, Global Asset Allocation and Private Markets Solutions
Brian P. Meaney
Senior Vice President, Taxable Bond Strategist
Candice Bangsund
Vice President and Portfolio Manager, Global Asset Allocation and Private Markets Solutions
Dexter J. Torres
Senior Vice President, Portfolio Manager, Head of Trading
Judy Wesalo Temel
Senior Vice President, Director of Credit Research

With an increase of new cases of coronavirus (COVID-19) in the US and community spread more likely throughout the country, there could be a slowdown in economic activity of businesses and individuals.  As we monitor the effects of COVID-19 on the overall bond market and credit quality, we are reminded of the significant amount of interconnection throughout our country’s and the world’s economy.  The focus of this bulletin is to highlight municipal bond sectors that may be most impacted by a sustained economic slowdown. These are the sectors that we are targeting for scrutiny and depending on the path that the COVID -19 takes, this list could broaden.  However, we do want to note that as part of our risk management, we seek to construct portfolios with very strong credits, taking into account sector and revenue diversification.

  1. Airports and Ports: With many businesses and individuals reducing travel and tourism, both abroad and domestically, airport revenues could decline. Direct airline revenues will not be the only source of revenue affected, as we will likely see reduced concessions such as parking and food services. Airports do have strong liquidity as a sector, with the 2019 Moody’s Medians showing 659 days cash on hand, which would help weather short term declines in enplanements. In late February we undertook a comprehensive review of our airport exposures and began trimming portfolios with the highest exposures to this sector. An extended slowdown could have a negative impact on both the supply chain and demand side for goods, which would be felt at ports.
  2. Tax Secured Bonds: State and local governments issue bonds backed by specific dedicated taxes, including sales and income tax.  Although a sustained economic slowdown could reduce collections of those taxes, debt service coverage has been strong for the past few years, so again, it would take a prolonged downturn to materially affect coverage.  Taxes that are less broad-based, such as hotel occupancy or gas taxes could be impacted more quickly. We want to note that most of the bonds that our clients hold have the broader income and/or sales tax pledge.

Sales Tax Collections as a Percent of Total State and Local Tax Collections

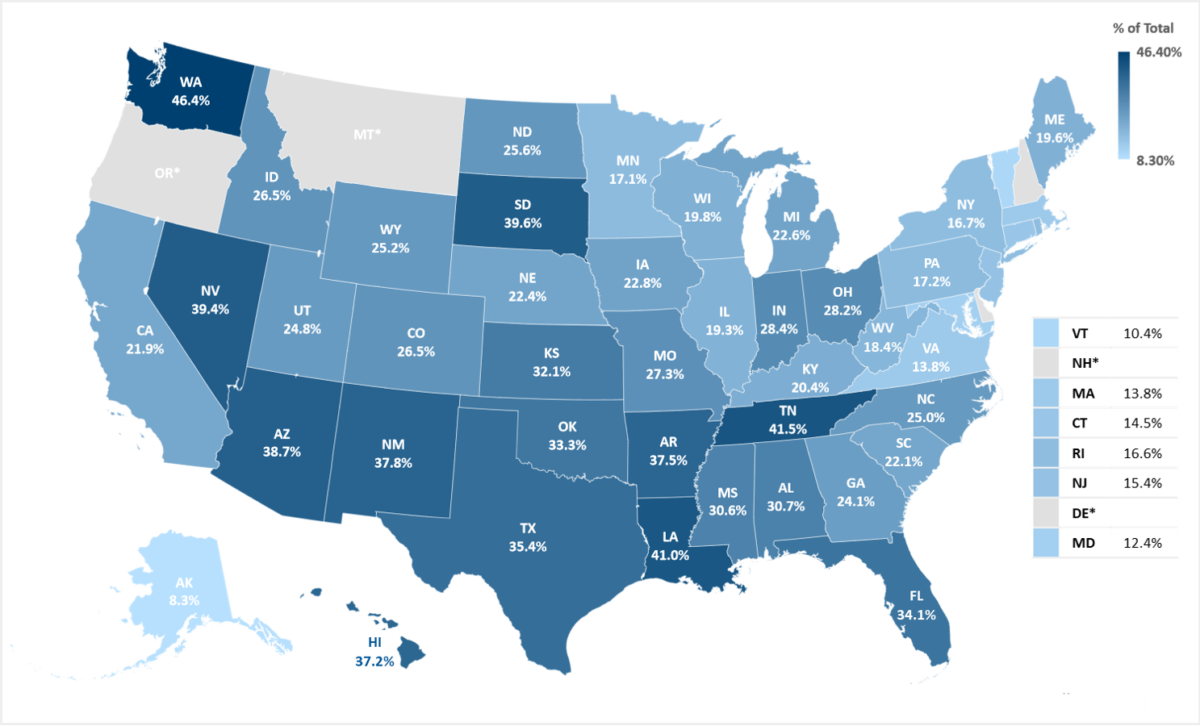
Note: *Delaware, Montana, New Hampshire, and Oregon levy neither a state nor a local sales tax.

Source: Census Bureau, Tax Foundation calculations Fiscal Year 2016.

  1. Mass Transit. A decline in economic activity could reduce mass transit ridership, however, most mass transit issuers have multiple revenue sources including sales tax or transportation related fees such as license renewals or gas tax. We believe this diversity of revenues should withstand a short-term shock. On the other side, a decline in mass transit may be coupled with an increase in individual car usage, which could increase gas taxes. 
  2. Health Care: Hospitals could face multiple challenges should COVID-19 become widespread.  These challenges include updating and training staff on how to deal with preparedness, adequate supplies, infection control, allocation of patient beds, changes in admission patterns including reducing elective procedures and other concerns.  It is a credit positive that more hospitals are parts of systems (2/3 in 2020, up from 58% ten years ago), so best practices and information can be more easily shared.  
  3. State and Local Government Taxes: The map below shows state dependency on sales tax. The 5 states that are most dependent on sales tax for their state budgets include Washington, Tennessee, Louisiana, South Dakota and Nevada. These states may see a greater impact of declining economic activity if the spread of coronavirus is sustained.  

Public health is one of the main responsibilities of state and local governments, as it aims to proactively have initiatives and programs that improve overall health in communities.  There are a wide range of programs, with prevention of chronic and infectious diseases amongst them.  This map shows public health spending by state in 2019, exclusive of Medicaid dollars.  The degree of public spending reflects, in part, the political priorities that a state bases on public health and may give some indication of state preparedness for public health crises.  

State and local governments do not operate in a vacuum in a crisis situation.  The US has shown time and again that when disasters strike, money flows into the places and sectors most affected, and we expect it would happen again if appropriate.  Fiscal and monetary policy can and has been used in the past to deliver on public policy objectives.   We will continue to update you as this fluid situation develops.

Public Health Funding by State: State dollars dedicated to public health and federal dollars directed to states per person

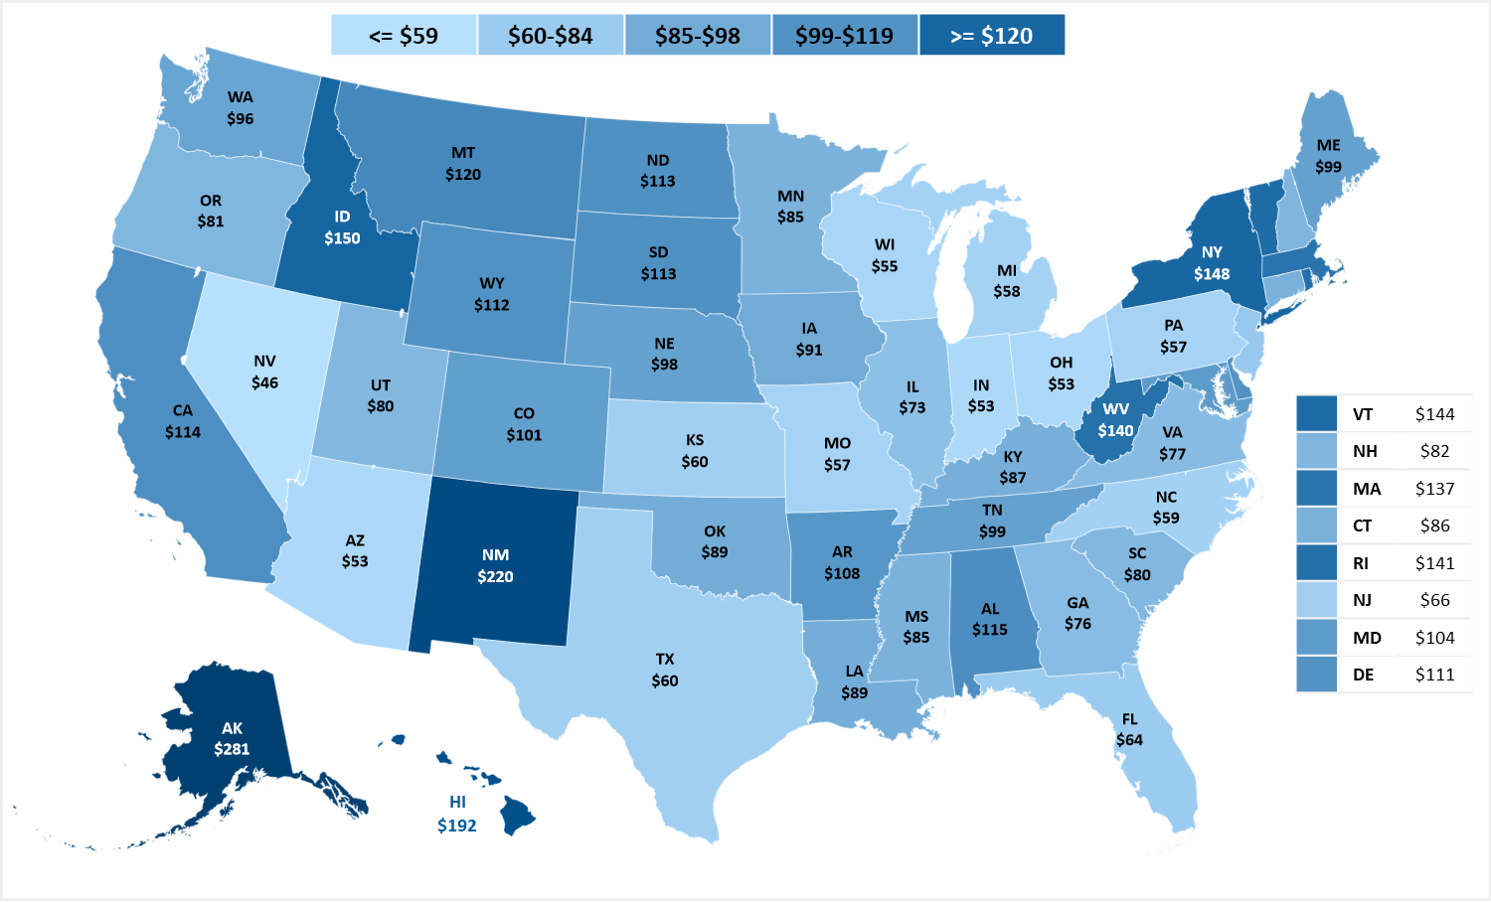
Source:  Trust for America’s Health; U.S. HHS; U.S. Census Bureau, Annual Estimates of the Resident Population: April 1, 2010 to July 1, 2018, 2017-2018

You can find Fiera Capital’s latest analysis and updates on COVID-19 by clicking here.

Disclosures

Past performance is not a guarantee of future results. Inherent in any investment is the potential for loss.

This document is not intended as investment advice or a recommendation of any security or investment strategy for a specific recipient. Investments or strategies described herein are provided as general market commentary, and there may be no account or fund managed by Fiera Capital Inc. for which investments or strategies described herein are suitable due to the various types of accounts or funds that are managed by Fiera Capital Inc. Nothing herein constitutes an offer to sell, or a solicitation of an offer to purchase, any securities, nor does it constitute an endorsement with respect to any investment area or vehicle. This material cannot not to be reproduced or redistributed without the prior written consent of Fiera Capital Inc.

Certain information contained in this document may constitute “forward-looking statements,” which can be identified by the use of forward-looking terminology such as “may,” “will,” “should,” “expect,” anticipate,” “project,” “estimate,” “intend” “continue,” or “believe” or the negatives thereof or other variations thereon or comparable terminology. Due to various risks and uncertainties, actual events or results or the actual performance of any strategy or market sector may differ materially from those reflected or contemplated in such forward-looking statements.

Statements regarding current conditions, trends or expectations in connection with the financial markets or the global economy are based on subjective viewpoints and may be incorrect.

The information provided is proprietary to Fiera Capital Inc. and it reflects Fiera Capital Inc.’s views as of the date of this document. Such views are subject to change at any point without notice. Some of the information provided herein is from third party sources and/or compiled internally based on internal and/or external sources and are believed to be reliable at the time of production but such information is not guaranteed for accuracy or completeness and was not independently verified. Fiera Capital Inc. is not responsible for any errors arising in connection with the preparation of the data provided herein. No representation, warranty, or undertaking, express or implied, is given as to the accuracy or completeness of such information by Fiera Capital Inc. or any other person; no reliance may be placed for any purpose on such information; and no liability is accepted by any person for the accuracy and completeness of any such information.

Any charts, graphs, and descriptions of investment and market history and performance contained herein are not a representation that such history or performance will continue in the future or that any investment scenario or performance will even be similar to such chart, graph or description. Any charts and graphs contained herein are provided as illustrations only and are not intended to be used to assist the recipient in determining which securities to buy or sell, or when to buy or sell securities. Any investment described herein is an example only and is not a representation that the same or even similar investment scenario will arise in the future, or that investments made will be as profitable as such examples or will not result in a loss to any such investment vehicles. All returns are purely historical and are no indication of future performance.